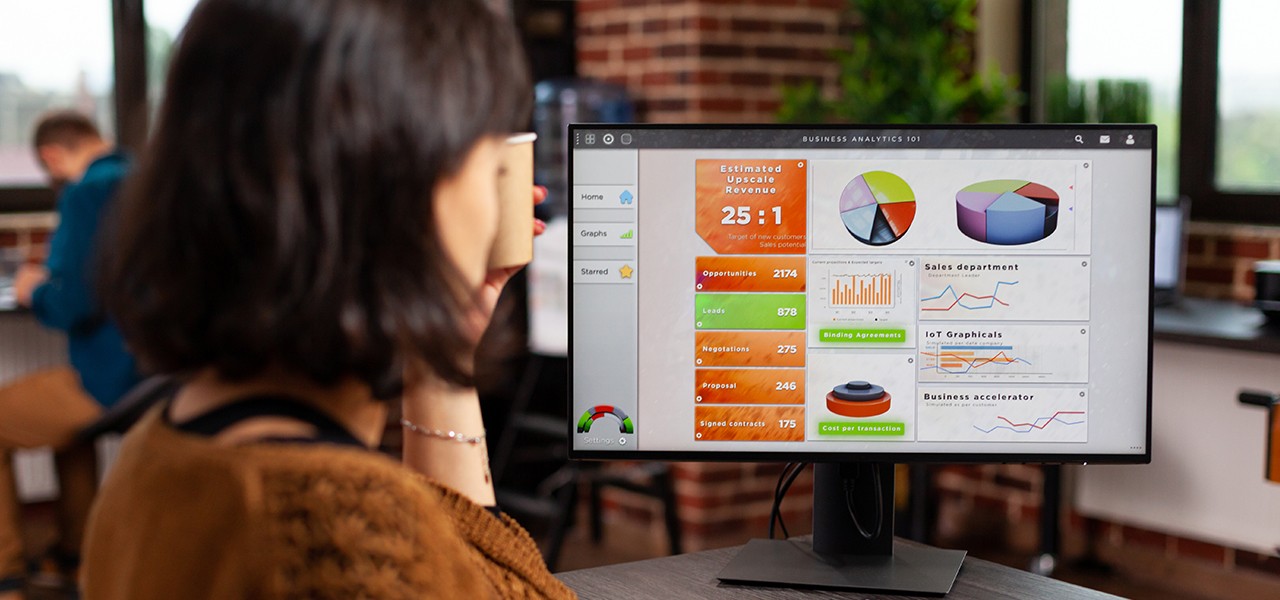
Customizable dashboards are powerful tools that enable businesses and individuals to visualize, monitor, and analyze data in a way that aligns with their unique needs and objectives. With the rise of big data and analytics, customizable dashboards have become essential for decision-making across various industries, allowing users to track key performance indicators (KPIs), measure progress, and gain actionable insights—all from a single, intuitive interface. In this article, we’ll explore the benefits of customizable dashboards, their key features, and how they can enhance business performance.
1. Personalized Data Visualization
One of the most significant advantages of customizable dashboards is the ability to tailor the presentation of data to meet the specific requirements of different users. Whether it's a sales manager looking to track weekly revenue or a marketing executive monitoring campaign performance, customizable dashboards allow each user to create a personalized interface that displays only the most relevant information.
For instance, a user might choose to display charts, graphs, or tables that focus on specific KPIs, such as sales conversion rates, customer acquisition costs, or website traffic. This flexibility ensures that users are not overwhelmed by unnecessary data and can focus on what matters most to their role. Moreover, the ability to design dashboards with different visualizations makes it easier to understand and interpret complex data at a glance.
2. Real-Time Data Monitoring
In today’s fast-paced business environment, the ability to track and react to data in real time is critical. Customizable dashboards provide users with live updates on the metrics that matter to them, allowing for immediate decision-making and course corrections. This is especially useful for industries where conditions can change rapidly, such as retail, finance, or e-commerce.
For example, an e-commerce business can use a customizable dashboard to track real-time sales figures, inventory levels, and website traffic. If the dashboard shows that a product is selling faster than expected, the business can immediately reorder stock or adjust pricing to capitalize on demand. On the other hand, if sales are below expectations, managers can identify potential issues—like poor website performance or a lack of marketing—and take corrective action without delay.
3. Enhanced Collaboration Across Teams
Customizable dashboards also promote collaboration across different teams and departments. By providing a unified view of data that can be shared across the organization, dashboards enable all stakeholders to access the same insights, fostering greater alignment in decision-making. Moreover, each team can customize their dashboard to highlight the metrics most relevant to their function, but still view the data in the context of the broader business goals.
For instance, a marketing team might use their dashboard to track metrics like lead generation, click-through rates, and conversion rates, while the sales team monitors metrics like pipeline velocity and close rates. Both teams can see how their efforts are contributing to the overall business objectives, ensuring that they work together more effectively.
Additionally, dashboards can be easily shared with executives or external stakeholders, offering a transparent and clear view of business performance. This capability ensures that everyone is on the same page and can make data-driven decisions that are aligned with the company's goals.
4. Simplified Decision-Making
One of the key benefits of customizable dashboards is their ability to simplify decision-making by presenting data in a clear and organized manner. Instead of sifting through large spreadsheets or complex reports, users can see relevant data at a glance, making it easier to identify trends, spot opportunities, or address problems.
For example, a CFO might use a financial dashboard to track expenses, revenue, and profit margins. By viewing this data in an easy-to-understand format, they can quickly assess the company's financial health and make decisions about cost-cutting or investment opportunities. The ability to drill down into specific areas of the data also allows users to explore the underlying factors driving certain trends, providing a deeper level of insight.
Moreover, dashboards can be set up to trigger alerts when certain thresholds are met, such as when sales drop below a certain level or when inventory falls below a critical point. These automatic notifications enable managers to take immediate action without having to constantly monitor the data manually.


